Tableau Public
PM2.5 & Mental Health Dynamics
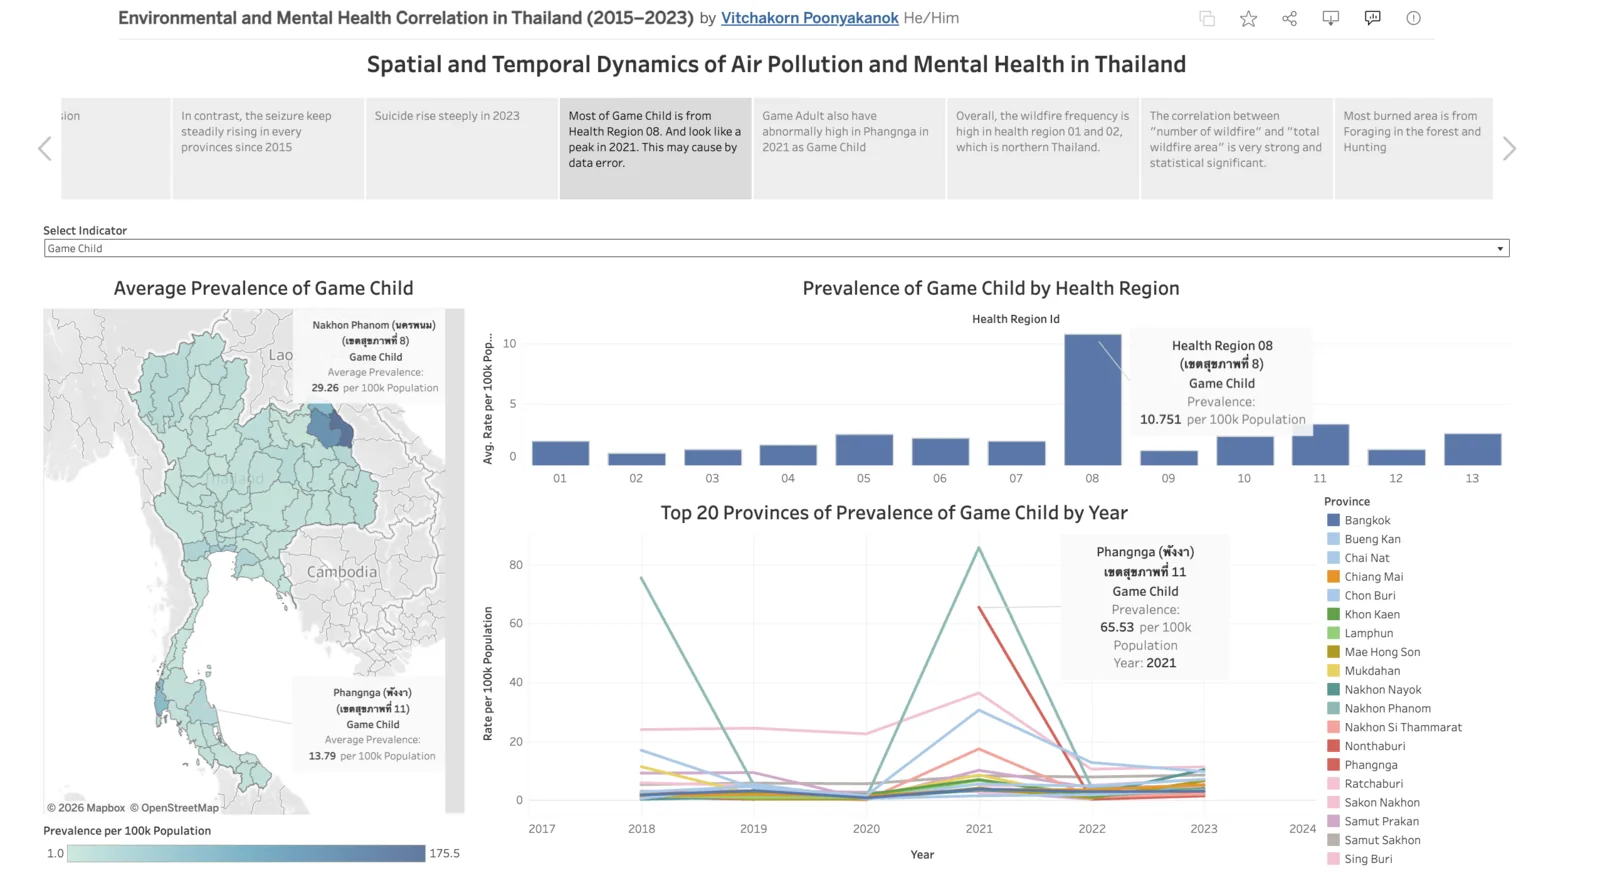
A spatial-temporal Tableau story visualizing the correlation between air pollution and psychiatric disorder visits, using Interrupted Time Series (ITS) modeling.
About This Project
Built as part of an exam project for the M.Sc. in Digital & AI Technologies in Health Systems at Chulalongkorn University, this story visualizes the spatial and temporal relationship between PM2.5 air pollution levels and psychiatric disorder visit patterns, using Interrupted Time Series modeling to look for shifts in the trend around pollution events.
Academic exercise: all data shown is for academic/coursework use and may not be fully accurate — this is not a validated epidemiological finding.
Tech Stack
Tableau
Interrupted Time Series (ITS)