Project Archive
Every project referenced from the Projects section of my portfolio, plus a few smaller builds that don't make the top carousel — deployed apps, dashboards, Kaggle notebooks, GIS/cartography work, and a video explainer. Each has its own case study.

Guardrailed Thai disease-surveillance LLM assistant using tool-calling over a PII-free data mart.

Extracts and analyzes multi-format travel itineraries for high-altitude illness risk.

Geospatial drill-down navigator unifying Thailand's scattered facility and area codes.

English/Thai calendar tool that shows whether a pilgrim's next period falls during Hajj and when delay medication would need to start.

Word add-in that permanently converts Arabic to Thai numerals, preserving emails and URLs.

Searchable Thai and English reader for Thailand's Communicable Disease Act B.E. 2558, with a bilingual Q&A assistant.


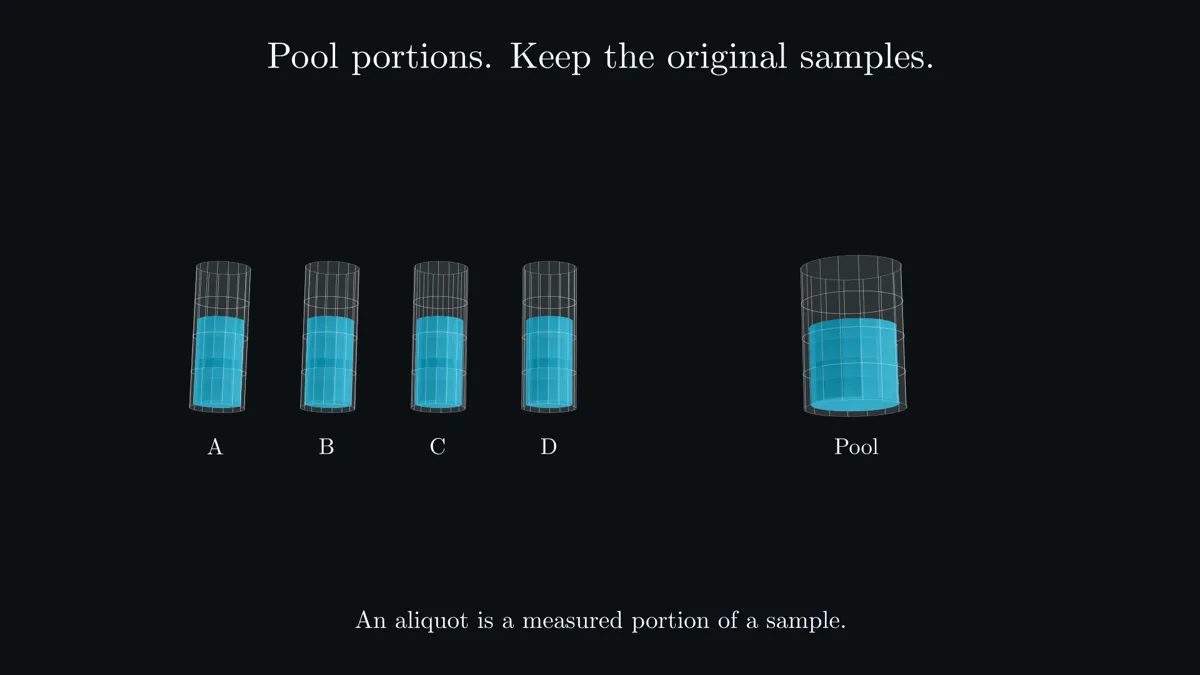
A 3Blue1Brown-style Manim video on pooled testing, its recursive re-splitting idea, and Dorfman's 1943 origins.
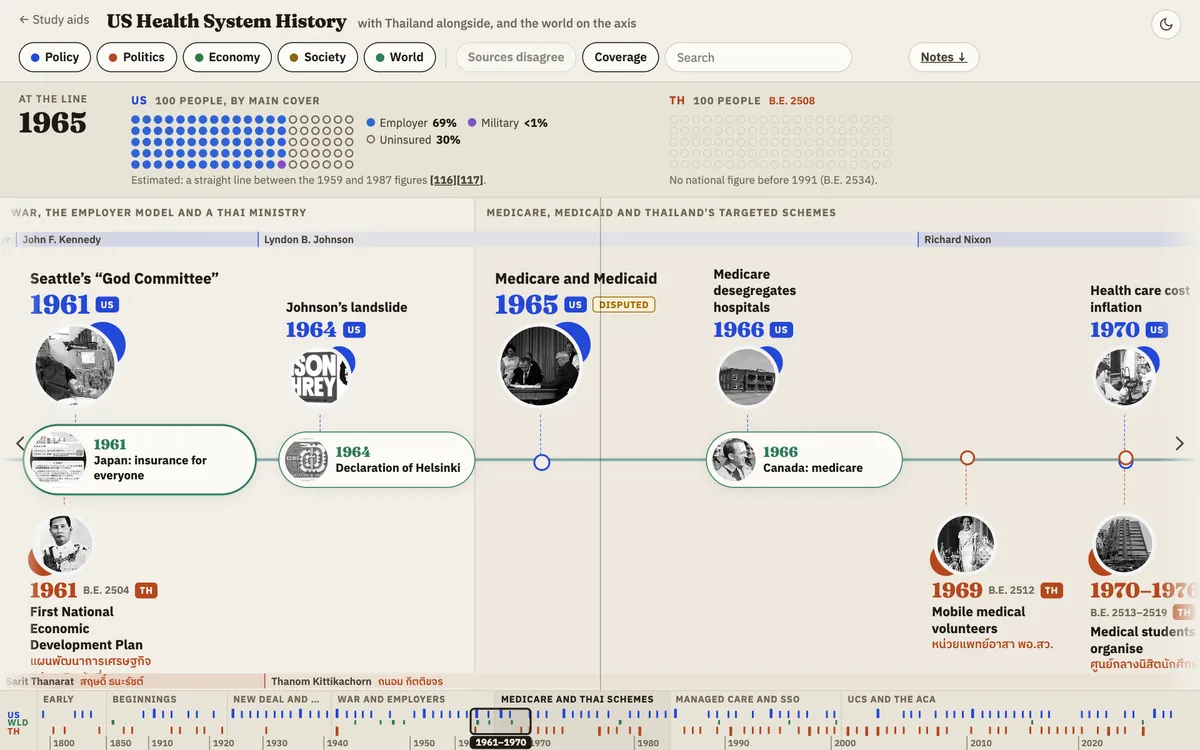
A photo timeline from the 1790s to today, written for CMU's Health Systems course: who is covered, how care is paid for, and where the sources disagree.
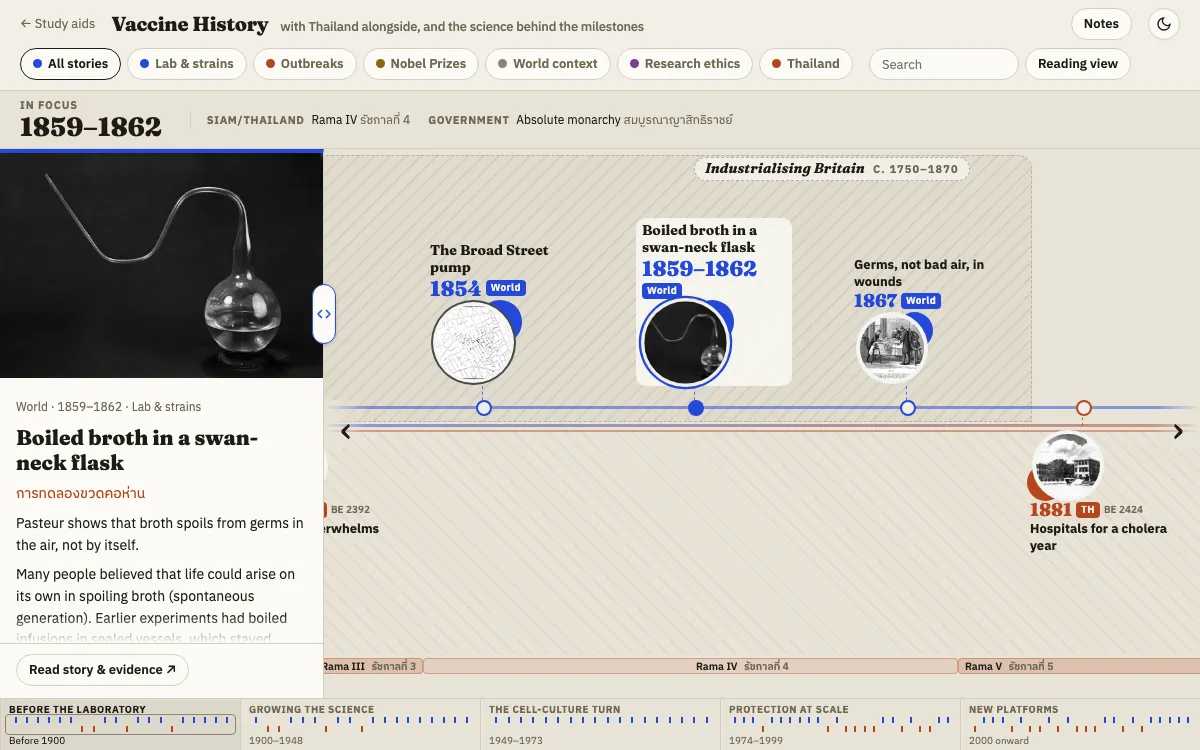
From the first microscopes and germ theory to RNA vaccines: discoveries, outbreaks and wars, with Thailand’s programme, reigns and governments alongside. 108 stories, each with its sources.
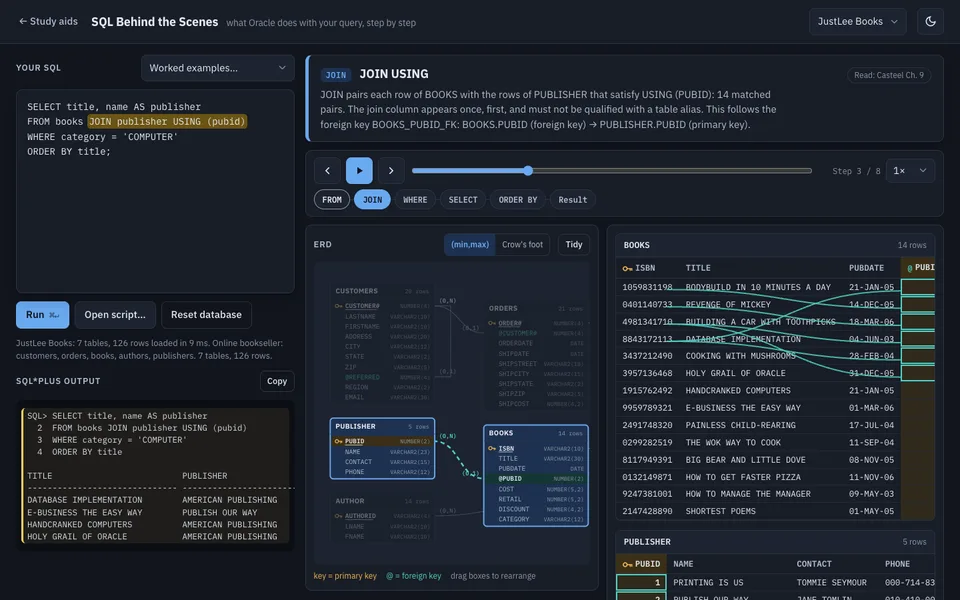
Type Oracle SQL and watch what the database does with it, clause by clause, beside an ERD whose keys light up as each step uses them, with SQL*Plus-style output.
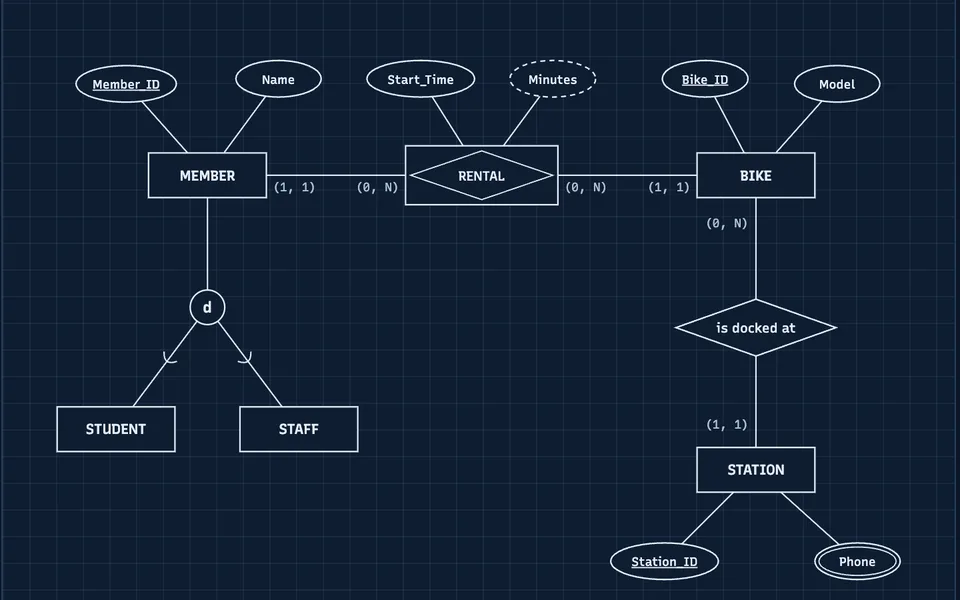
Draw ER diagrams in the class's Chen notation, normalize tables stage by stage and run relational algebra as a query tree, with every (min, max), key, dependency and normal form checked as you go. Opens draw.io files.
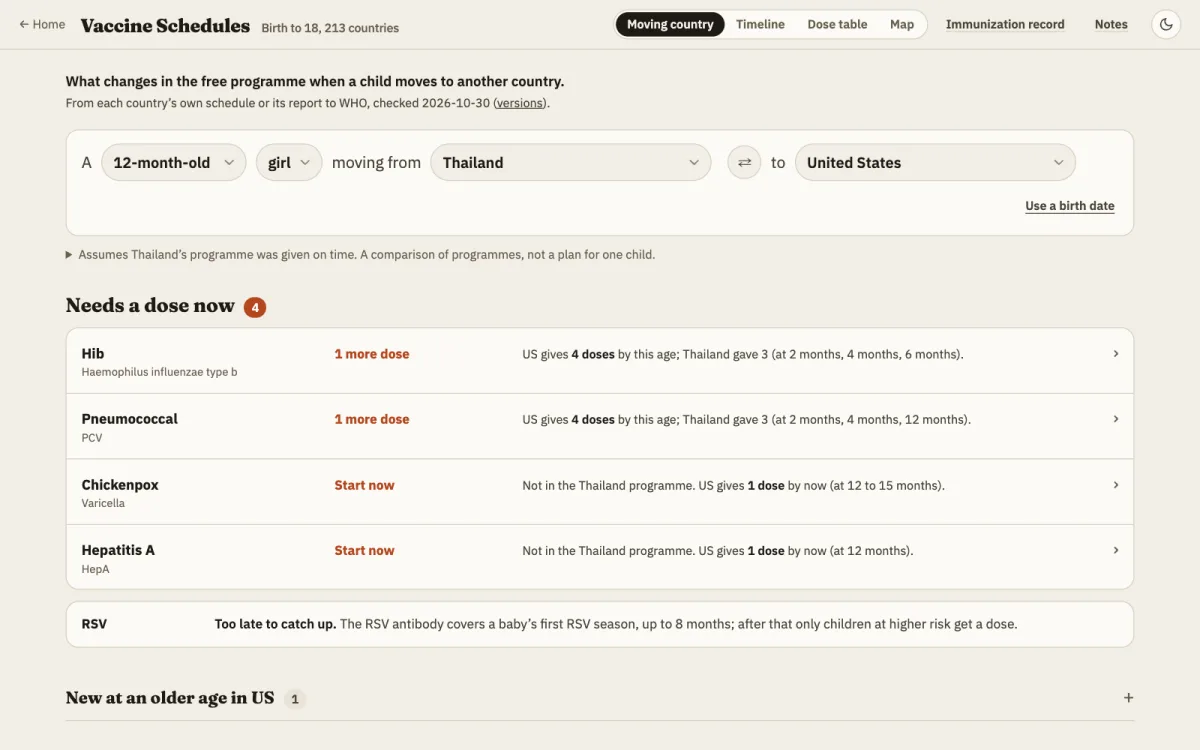
See what changes when a child moves to another country, compare twelve national childhood schedules on one timeline or in a dose table, or see one vaccine on a world map of 213 countries, birth to 18.
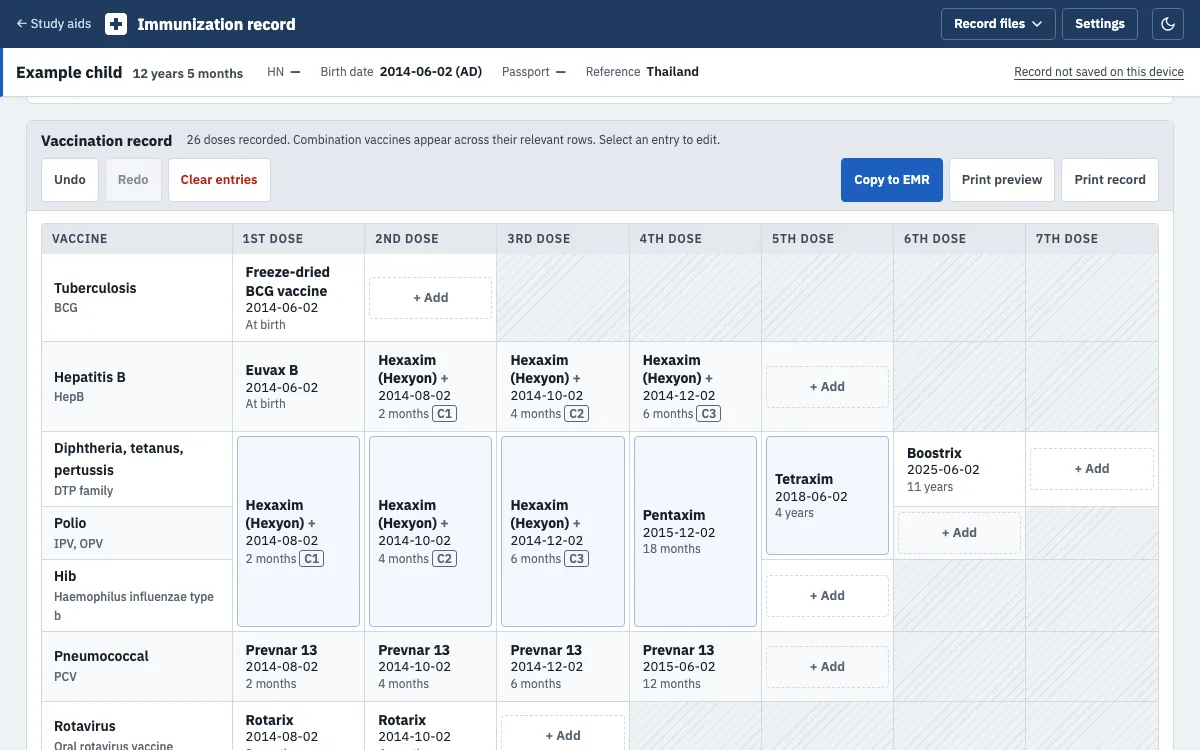
Enter vaccines and labs, copy to EMR, import or export records, review historical guideline milestones and print an A4 or Letter record.

Multi-class ensemble model (XGBoost/LightGBM) for cirrhosis survival and transplant outcomes.

First end-to-end ML project, scraping to prediction, forecasting an entertainment-industry election.

Hand-drawn bilingual altitude and transit map for high-altitude consults, the start of the metro-style altitude maps.
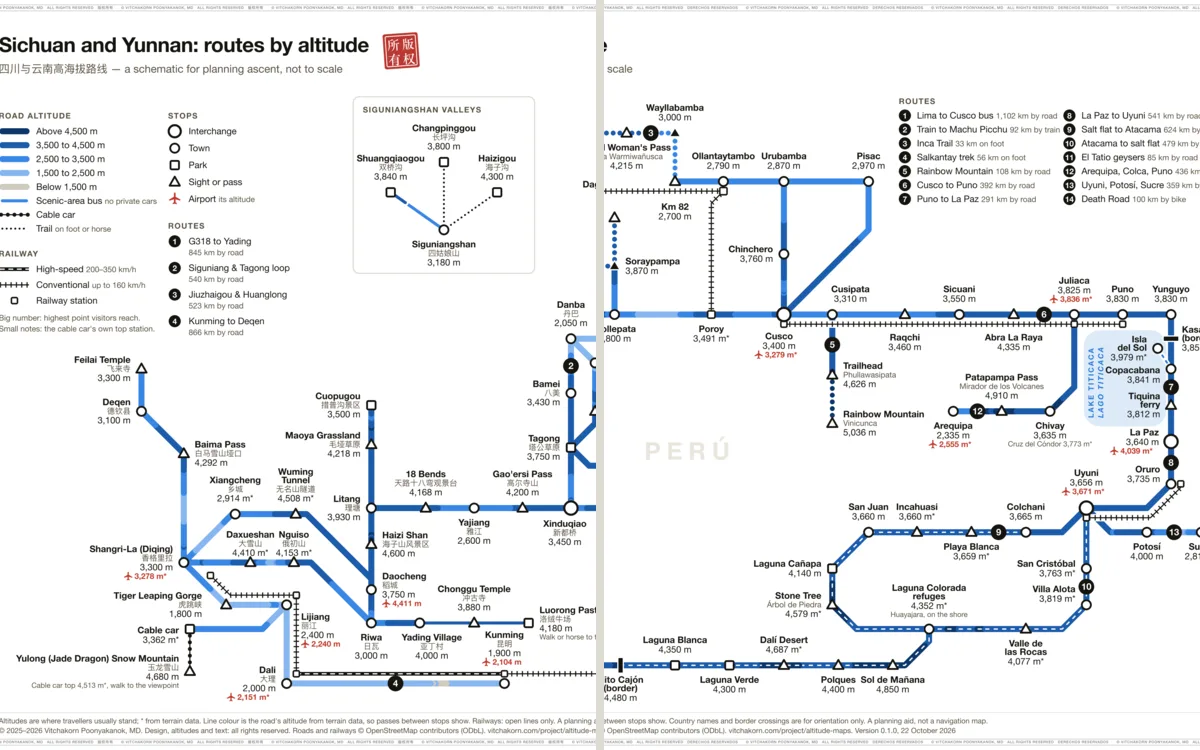
Route diagrams and interactive 2D and 3D maps that show which nights climb too fast, region by region: Sichuan and Yunnan, and Lima to the Atacama.

Hand-corrected world shapefile restoring small nations standard basemaps drop.